|
|
|
|
|
|
|||||||||||||||||||||||||||||||||||||||
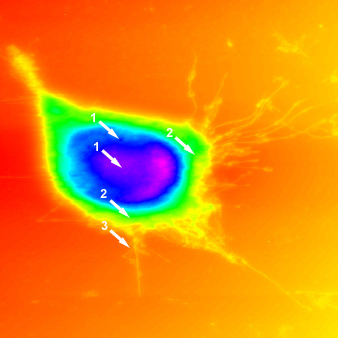
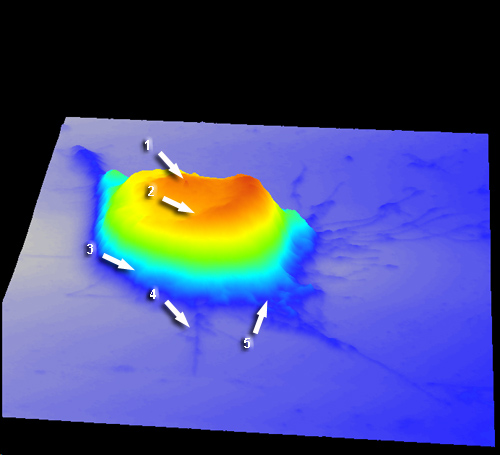
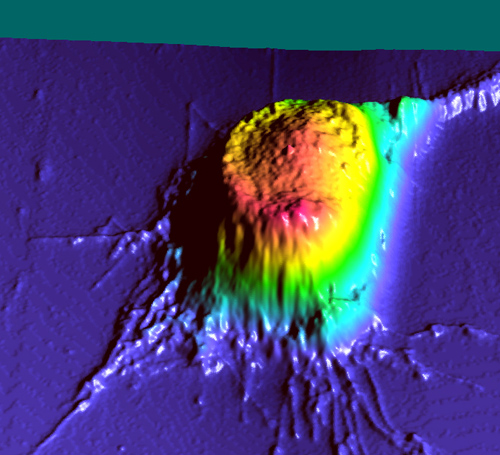
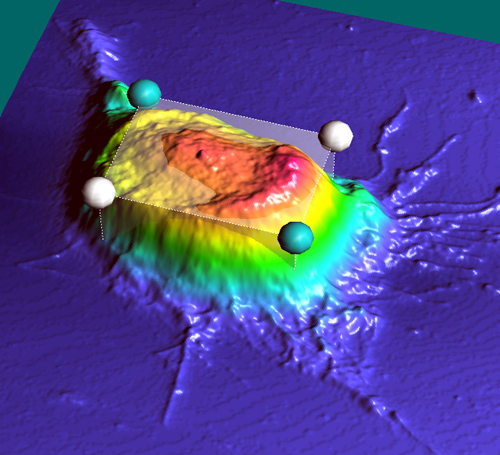
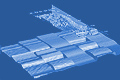
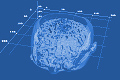
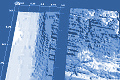
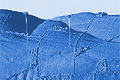
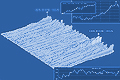
3D
visualization for microscopy
| 3D art ActiveX GIS map Forensic 4D volume Laser Multilayer CCD IR images Resources 1 2 3 4 Bio Imaging Hybrid AFM | |
| Europe FringeCatch AFM Products | |
|
Address: 140 North Main St., Suite 2A Attleboro, MA, 02703 / Phone: (401)-323-0603 (voice) |
|
ATI™ is used under license
and is a registered trademark of ATI Technologies Inc. in the United States
and other countries.
-----------------------------------------------
Copyright © 2003-2013 ScienceGL,
Inc.