ScienceGL Inc. 3D Laser Beam Profiler and Analyzer system features advanced visualization software implemented in both 2D and 3D visualization modes. The 3D surface exhibits the height (Z) proportional to the local laser beam intensity in XY plane perpendicular to light propagation direction. The 3D visualization screen is constructed real-time to provide you with the fast feedback on laser operation conditions. The important feature of the system is fast 3D surface constructor that permits to follow laser beam intensity temporal fluctuations. Corresponding data stream from CCD imager consists of XY pixel position, Z intensity of the beam in each pixel and the time, i.e. frame number. This kind of data by definition is 4 dimensional (4D) data stream, where 4th dimension represents the time. The system provide full support for 4D visualization while preserves maximum possible virtual reality type 3D surfaces of realistic perception. More, you can use our unique set of 3D interactive tools for accurate beam measurement. 3D window is rendered in real time with up to 60 fps speed. You can adjust your Laser optics and working parameters while observing 3D beam intensity surface at variable angle and direction. The 3D surface can be zoomed and scrolled in all directions to let you see what matters the most in your laser beam profile. This feature makes a big difference when precise laser diagnostics is needed.
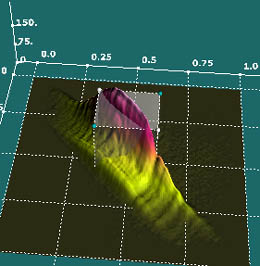
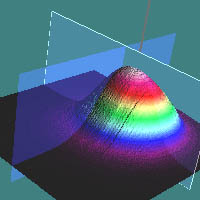
Interactive 3D orthogonal cut plane tool (slicer). The tool is designed for fast laser beam profiling with mouse controlled X,Y planes in 3D window. The software reads 1D orthogonal cut, i.e. the intersection between laser beam surface and the plane. The resulting profile is drawn together with Gaussian fit for detailed profile analysis. The plane is moved with mouse in 3D window to provide you fast and easy access to any position of the interest.
More
3D interactive tools (Advanced features):
-Volume measuring tool that is proportional to a total beam power
within any range of interest (ROI)
-Mouse and pin markers read out of the local laser intensity of the
beam
-Distance measurement, that lets you read XY distance and intensity
difference between any 2 points of the laser beam
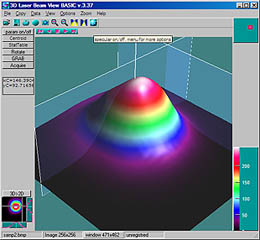
The contour tool is used for 3D laser beam mapping. Contour visualized over 3D surface helps you to see laser beam intensity map detail. The contour layered with color map and 3D surface shadows gives you the best possible perception of the beam shape. You can easily observe small fluctuations of laser beam in real-time (noise, fine mode structure, etc.)
3D
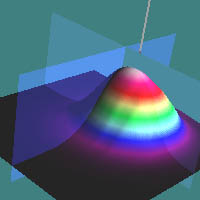
Image Enhancement using Inclined Surface Illumination.

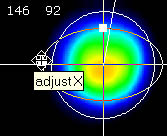
The light Direction Tool lets you change the angle of the incident
light relative to the surface in 3D space. The Laser Beam fine structure
is better visualized at certain angle of illumination. The fast 3D
render is vital for this operation, because you need to follow the
beam features immediately while moving light over the surface or while
rotating the surface in all 3D angles. The
tool is activated with mouse operation over the light control pad
as shown in picture above.
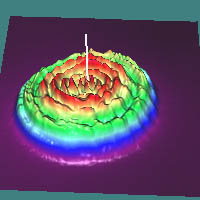
The 3D interactive visualization is perhaps the best way to reveal the fine structure of the laser beam under inspection. In example shots on the left side we demonstrate
Upper image: non-calibrated CCD imager response shown as 3D surface.
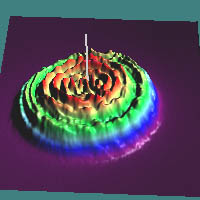
Lower image: 3D surface after calibration map is applied to same CCD frame as in previous image.. The pixel noise for the case of non-calibrated CCD output is easily seen in 3D surface while impossible to detect with traditional 2D representation.
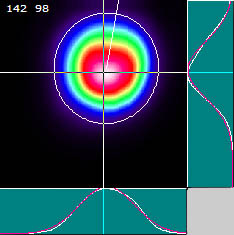
We provide user with possibility to analyze laser output in both 3D advanced mode as described above and traditional standard 2D mode as demonstrated in the picture on the left side. The 2D screen, while similar to that of a standard 2D imaging package, provides user with several unique features developed by our company. On the sample image (see left) the laser beam is plotted together with our advanced true least square fit for 2D power ellipse. The 1D plots of the beam intersection profiles and corresponding Gaussian fits are also drawn at right and bottom sides of the 2D window. User defined palettes are used for pseudo coloring the laser beam image with Look Up Table (LUT).
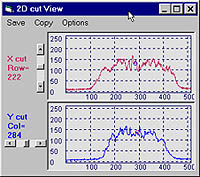
1D intersection plot for both X and Y beam profiles is drawn in the separate Cut View form. This feature is designed for fast profile inspection. The plots are immediately drawn while user moves 3D cut-plane (within 3D window) or 2D target point (within 2D window). In Live mode user observe live updated intersections. The Cut View form also provides user with Gaussian fit plot, profile copy / save report utility and exact pixel position setting for each vertical and horizontal profile lines.
The tool is used to select any elliptical area of the laser beam for total power calculation. The laser beam can be analyzed within area of the automatically generated Power Ellipse (least square Ellipse fit) as well as within any elliptical area defined by user (User Bucket).
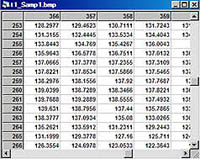
The tool gives user access to pixel data values within multiple data table form. Data tables are similar and compatible to that of MS Excel and other spreadsheet applications. The tool can handle several data tables at the same time with all common spreadsheet features such as copy / paste cell data, edit cells, etc. Fast data exchange with 2D and 3D window is also implemented.
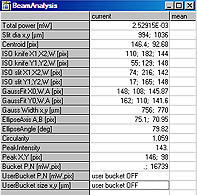
Laser
Beam statistics:
-ISO knife width, ISO slit width-Gaussian fit width, amplitude
-Full power, user bucket power calculation
-Ellipse fit with parameter reporting (circularity, width, inclination
angle, etc.)
NOTE: The Gaussian fit is implemented as incremental digital true
least square algorithm rather then approximate polynomial algorithm
found in most of the alternative software packages. While significantly
more complicated computational task our algorithm provides much better
accuracy in beam profile Gaussian fitting. This is important when
exact Gaussian beam shapes needed to be analyzed from experimental
profile data.
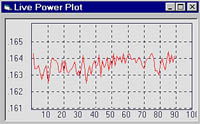
The Power can be drawn in real time for laser tune and adjustment. Each power point is plotted in separate form immediately after live image acquisition. The plot is automatically scrolled as new data point arrives similar to familiar digital oscilloscope screen. The parameter of interest to be drawn in this tool is selectable in advanced version of the software.
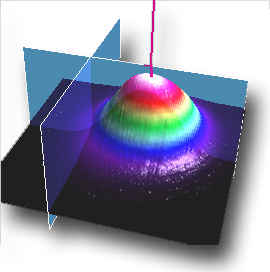
ScienceGL Inc. has developed a set of interactive 3D measurement tools for fast and easy, yet accurate laser beam diagnostics:
-3D distance measuring tool
-3D area ROI tool
-3D volume measurement cube tool
-3D labels
-3D markers (pins)
-3D axis
-Horizontal intersection plane (water line tool)
Implementation
OS: Microsoft Windows 98/NT/2000/XP/Vista
Developer SDK
For developers we offer SDK for several IDE's:
VS6 C++ VB, VS7 C#, VB.NET, LabView, Delphi
3D visualization components are available for developers.
CCD Integration
We provide full integration of the system with 3rd party partner cameras and custom cameras.