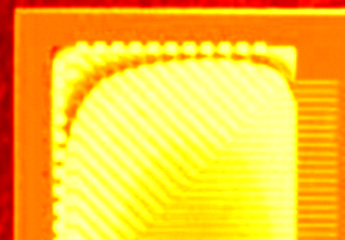
2D heat map picture of the semiconductor chip under operation.
ScienceGL
3D visualization map for
thermography and IR image enhancement.
Thermal 3D Demo Quick Startup Help
1. General notes.
Introduction.
Generally 3D visualization is not difficult procedure, but it requires some
understanding of what 3D surface is all about. As a reward of spending your
time on basic concepts below, you will gain a very powerful tool for 3D IR mapping.
The main concept
behind 3D thermography is the fact that by definition thermal (IR) image is
3D data set. Y and X directions represent pixel position on the object, while
Z dimension is the temperature of each pixel point of interest. The idea of
3D visualization is very simple. We just plot thermal map in most natural way
preserving all features as recorded by infrared detector (IR). After that we
apply to your personal experience in the real 3D world by providing you virtual
reality type of the surface that is much more informative as compared to standard
2D picture. The experience of your brain on how the real things (or objects)
look like gives you much more perception of map details that are typically lost
in 2D pictures. While most of the software packages will ignore the 3 dimensional
nature of thermal image, the fact is that 2D colored or gray image does not
reproduce 3rd and the most important temperature related dimension, i.e. Z height
proportional to temperature. As a result, typical IR software will offer to
you an image like this:
2D heat map picture of the
semiconductor chip under operation.
With 3D thermal
map visualization approach you will get much better perception, like this:
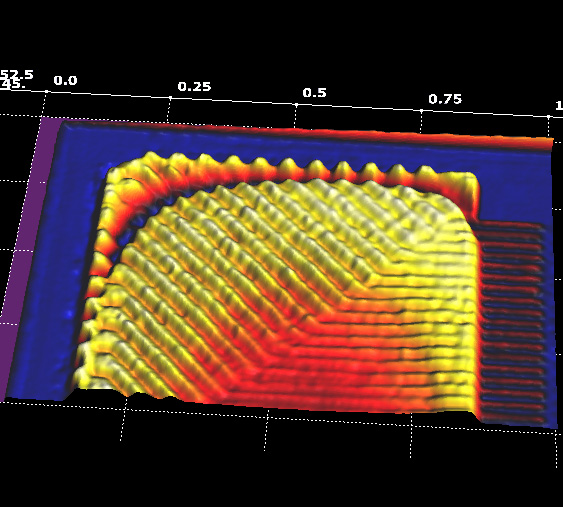
3D heat map visualization of a semiconductor chip, small temperature differences are enhanced with coloring and 3D shadowing.
The difference
between 2 images above is quite obvious. 3D imaging in thermography brings you
vast new possibilities. In some respect IR image to 3D thermal map surface can
be considered as a most natural approach in IR data enhancement.
Until recent couple
of years advanced scientific 3D visualization was exclusively used by high-tech
industries and leading research organization, such as NASA, NIST, etc. We tried
to make 3D thermography visualization software easy to use and affordable to
obtain for academic scientist / student and for smaller industry users / system
integrators. For all, who can not afford spending much money and time for difficult
to use, huge visualization engines, but rather needs a simple software tools
to see what matter the most in his practical problem. So, we made the software
that will make you immediately productive. This manual is aimed to streamline
your 3D infrared experience and productivity.
With ScienceGL 3D visualization software you can bring multiple IR images into
same 3D virtual reality live interactive screen for fast comparison and interactive
temperature measurements. Detailed user defined drilldown brings you to convenient
charts you accustom with.
2. Installation
Just run setup MSI (Microsoft installer) file from CD or downloaded to perform 3D IR map software installation.
3. Loading Files, General Operation.
Run the program.
Use "Thermal1" button to load the sample data IR images into the program.
The sample data thermal files are enclosed into install, after load you will
see the image like Fig.1.
The data is presented as temperature calibrated surfaces.
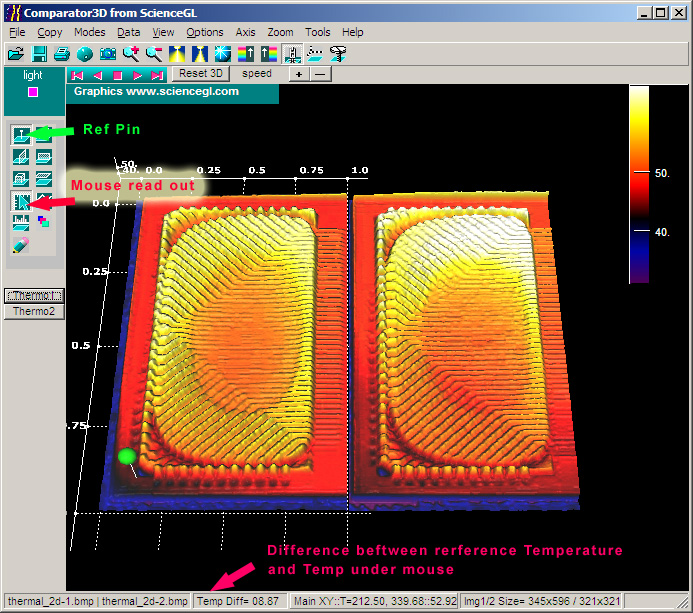
3D map comparison for 2
microprocessor chips under working conditions. Temperature measuring and comparison
reference pin is active and shown as green marker. Mouse temperature read out
is active. Moving mouse over thermal maps reads out temperature difference between
reference pin and current mouse position.
Initiate reference temperature point marker as shown with green arrow above. Initiate mouse temperature read out as shown with red arrow above. See temperature difference in status bar.
Next step is to
drilldown the temperature data. You can initiate 2D intersection plot by clicking
left tool bar button as shown in following picture.
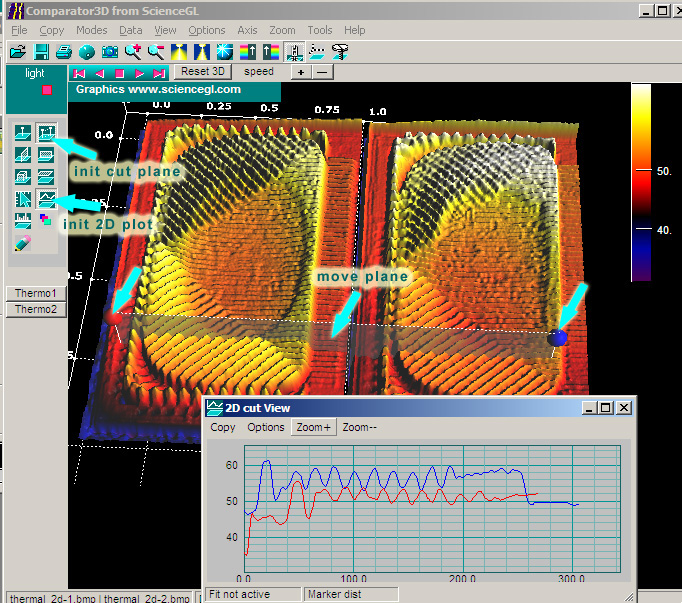
3D thermal map comparison for 2 semiconductor chips under working conditions.
Temperature intersection measuring tool is active and moved in 3D scene as shown
with cyan markers.
2D intersection plot is active. Move plane with mouse over semi-transparent
plane, move anchors with mouse drag over red or blue spheres.
To initiate 2D
plot click View2D button on toolbar as shown above.
A very useful temperature comparison tool is Volume Cube initiated from left
toolbar as shown below with cyan arrow..
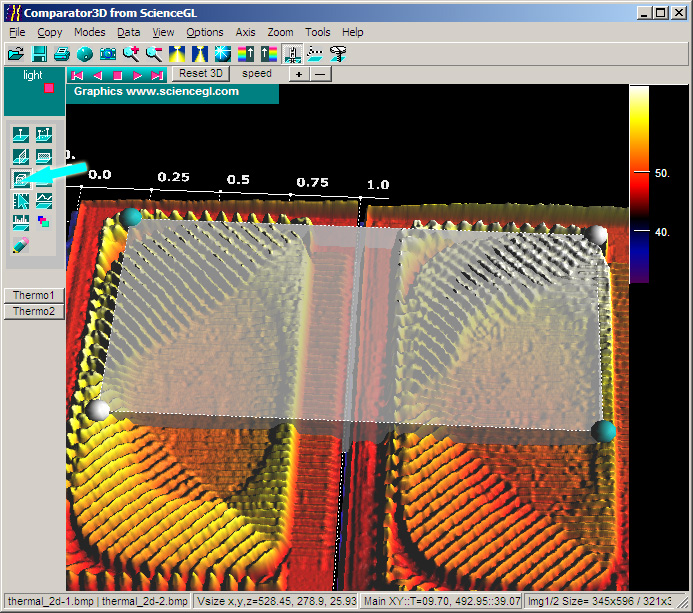
The thermal map comparison mode, 2 IR images loaded. Volume tool is active.
It is easy to see that right IR image has higher temperature as compared to
left one. Detailed report in volumes of the surface above upper cube plane is
available in full version. The volume returned is proportional to thermal flow.
4. Toolbars
There are Main Toolbar, Left Toolbar and Layer Toolbar in this application.
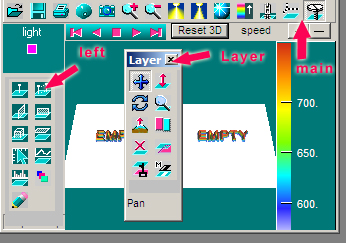
Screen
shot: Main Form. All toolbars.
The Main and the left toolbars
are always visible. The Layer toolbar is called with ![]() button.
button.
Main Toolbar
1 2 3
4 5 6 7 8 9 10
11 12 13 14 15
![]()
Screen shot: Main Toolbar.
Operation:
1. Double image load form
2. Save screen image
3. Print Screen
4. 3D options dialog
5. Screen shot to clipboard
6. Zoom 3D up
7. Zoom 3D down
8. More light to the scene
9. Less light to the scene
10. Specular Reflections on/off
11. Toggle between predefined palettes. Palettes are tunable with 3D options
dialog, see #4 above
12. Compress Data on/off. Compression improve 3D performance at the price of
quality of 3D
13. 3D Axis on/off
14. Layer toolbar on/off. Layer toolbar brings tools for test image (layer)
analysis and manipulation
15. CCD Capture tool on/off, markers for capture on/off.
Left Toolbar
This toolbar provides fast access to 3D measurement tools as numbered from 1 to 11
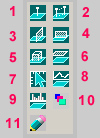
Screen
shot: Main Form. Left toolbar.
The operation as follows:
#1 Pin markers on/off
#2 Distance measuring tool on/off
#3 Y plane on/off
#4 X plane on/off
#5 Volume tool on/off
#6 Z plane on/off
#7 Mouse read out on/off
#8 Intersection Cut View plot on/off
#9 Histogram plot on/off
#10 Range of interest tool (ROI) on/off
#11 Report form on/off
The significance and operation
of the tools are described in corresponding sections of this help.
Layer Toolbar
This toolbar provides fast access to 3D operation with test image (layer) as numbered from 1 to 10
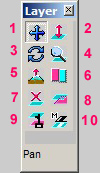
Screen
shot: Layer toolbar.
First 6 buttons provide
6 Modes of mouse operation on layer as numbered in figure above:
#1. Pan Layer with mouse, move XY directions - Mouse pointer ![]()
#2. Move Layer in Z direction - Mouse pointer ![]()
#3. Rotate Layer - Mouse pointer ![]()
#4. Zoom Layer, all directional zoom - Mouse pointer ![]()
#5. Data Zoom, Z zoom elevation data - Mouse pointer ![]()
#9. Lock Layer with main surface (move 2 layers together)
While Layers are locked to each other the left mouse will rotate both images,
the right mouse will Pan both images. The current selected operation is shown
at the bottom of the toolbar. While Pan selected the mouse drag within 3D window
will move layer. Similarly mouse operates in other modes such as Rotate or Zoom.
In addition from Layer toolbar you can perform several other tasks
#6. Reset layers
to the side-by-side position
#7. Clear all translations and rotation of the layer to Zero values
#8. Make Layer Semitransparent
#10. Construct masked layer
3D Animation Toolbar
This toolbar provides fast access to 3D animation of the scene as numbered from 1 to 8
1 2 3 4 5 6 7 8
![]()
Screen
shot: 3D Animation toolbar.
The operation as follows:
#1 Fast rotate 45 degree clockwise
#2 Animate with clockwise continuos rotation
#3 Stop Animation
#4 Animate with contra clockwise continuous rotation
#5 Fast rotate 45 degree contra clockwise
#6 Reset 3D angles and zooms to default values
#7 Faster animation
#8 Slower animation
5. Masked Temperature of interest operation
In many cases one might need to visualize only hot temperature data subset from ID image. We provide such possibility with Layer Toolbar button 10 (see previous section). First you can set Temperature Range of interest (T-ROI) with menu Data> Filter Z. In example below we cut low temperatures 30-45 C degree. After that using mask button you can construct 3D surface of hot masked areas of the IR image.
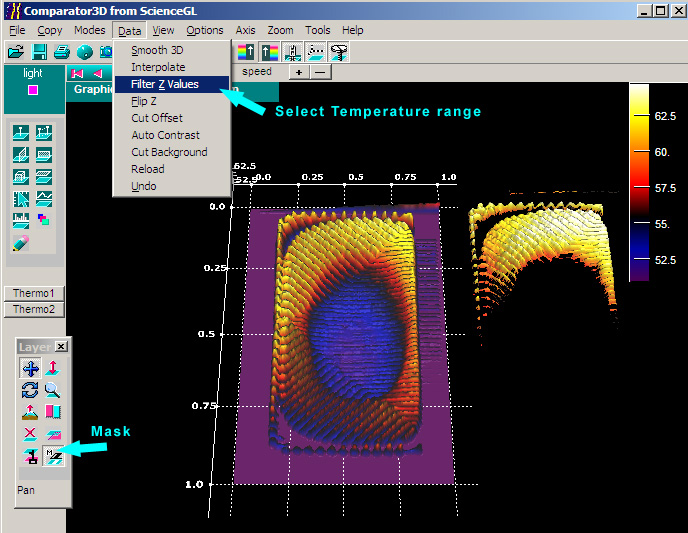
Screen
shot: 3D Temperature range of interest set 45-70 C degrees. Mask is activated
over layer test image. Mask hides irrelevant part of the surface under comparison.
Now the layer can be moved with mask to main surface for detailed comparison
of temperature maps.
For more information please contact Contact ScienceGL: Advanced 3D Graphics
Visualization
is Art of Science
| 3D art ActiveX GIS map Forensic 4D volume Laser Multilayer CCD IR images Resources 1 2 3 4 Bio Imaging Hybrid AFM | |
| Europe FringeCatch AFM Products | |
|
Address: 140 North Main St., Suite 2A Attleboro, MA, 02703 / Phone: (401)-323-0603 (voice) |
|
ATI™ is used under license
and is a registered trademark of ATI Technologies Inc. in the United States
and other countries.
OpenGL
is a registered trademark of SGI
-----------------------------------------------
Copyright
© 2003-2013 ScienceGL,
Inc.