3.
Loading Files, General Operation.
Run the program. Use "Data" button to load the sample data into
the program.
The sample data is enclosed to installation package. After load you will
see the image like Fig.1a,b
The data is presented as relative performance normalized on starting point
of the historical S&P 500 data.
The general
concepts of the visualization are as follows from Fig.1a,b below. You
can click this image to enlarge.
.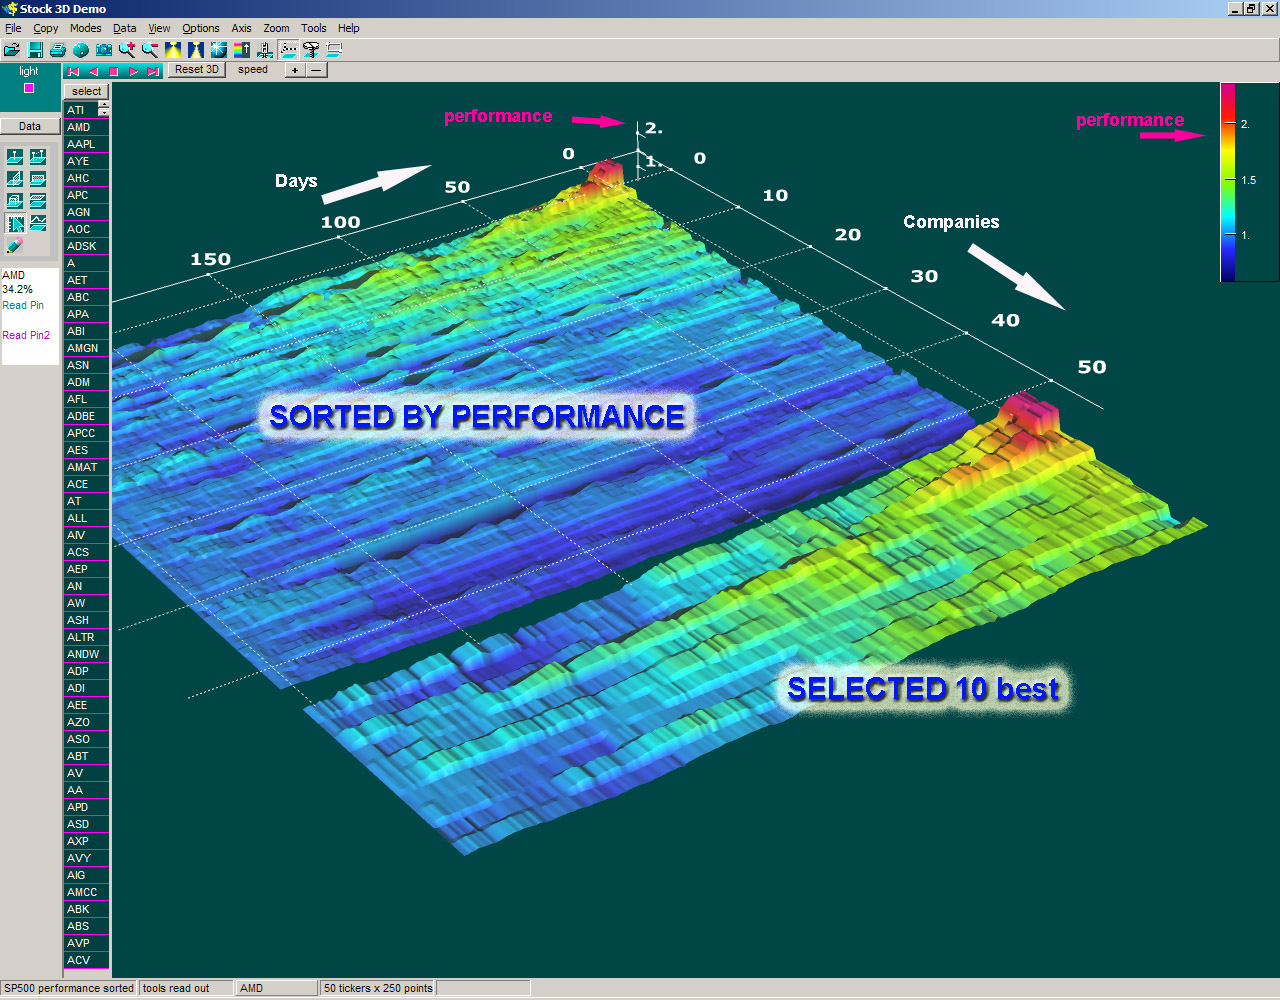
Fig.1a 3D representation of Financial S&P 500 historical data. Main
concepts.
Each company is represented as "tape" drawn in direction of
Date/time. There
are 2 surfaces available in demo: one is the full data loaded and second
is the default selection of 10 best performing symbols. The selection
can be made with left side list of all symbols loaded. The height of the
tape is proportional to normalized performance of the symbol. For easy
perception the performance of symbols is colored with palette. By default
the symbols are sorted by symbol performance. Advantage of 3D visualization
is that you can immediately evaluate performance of multiple symbols in
one screen. In example above it is 50 companies in main surface and 10
companies in selection surface. According to the palette best performing
tickers are colored as red, while medium as yellow (cyan), worst as dark
blue. After general evaluation you can drill down the data by moving mouse
or 3D pins within any point of interest, i.e. any date/time for any company.
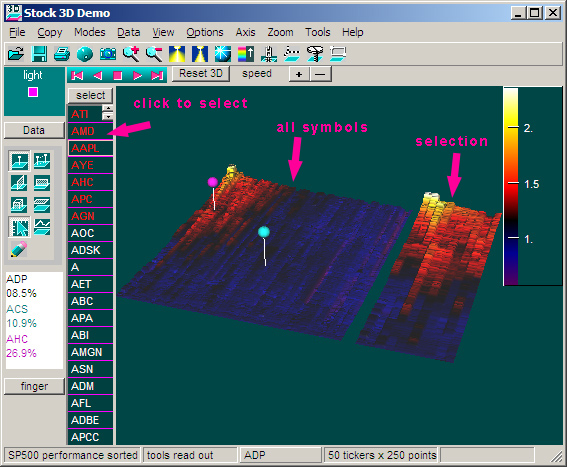
Fig.1b Financial
historical S&P 500 market data in 3D Visualization mode. The symbol
selection tool is located on the left side.
This tool lets you to select / un-select some stocks of interest from the full list of tickers loaded. Selection is represented as second multiple-symbol surface.
You can select
symbols of interest by clicking corresponding tickers on selector tool
as shown in Fig1.
When your selection is ready press "select" button. On left
side of the 3D plot you can see all the data loaded, on right side of
the 3D plot you can see selected symbol data plotted as separate surface.
Next step is to drilldown the data. You can initiate 2D plot by clicking
left tool bar button as shown in Fig.2
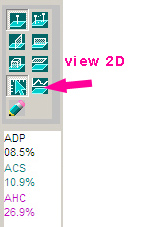
Fig.2 To initiate
2D plot click View2D button on toolbar.
The data on the 2D plot depends on mode of operation you are currently
using.
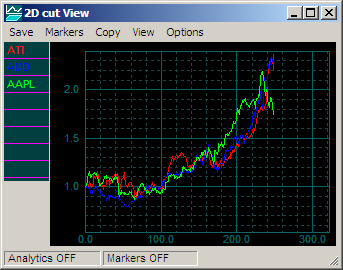
Fig.3 Charting Stock selection. Assuming that you have selected 3 symbols
with Stock selection tool you will have the 2D plot of selected symbols.
Note that selected items are shown as red, un-selected as white symbols.
Within Selection tool as shown in Fig.1.
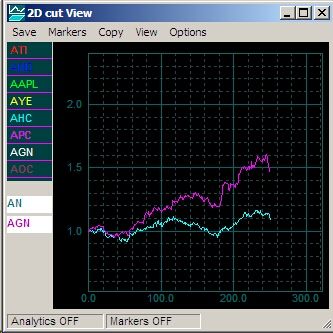
Fig.4 If you use pins to select symbols you will see double pin plot as
magenta and cyan plots.
When pins are selected you can read out the data from pins.
When mouse read out is active you can see the current position of the
mouse in terms of Ticker, and performance in %.
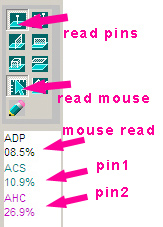
Fig.5 Read
out is possible either with pins or with mouse moved over point of interest.
The mouse reports symbol and relative normalized performance in any point
of the interest.